Page 12 - Moreno Valley City Manager's Report for 2021
P. 12

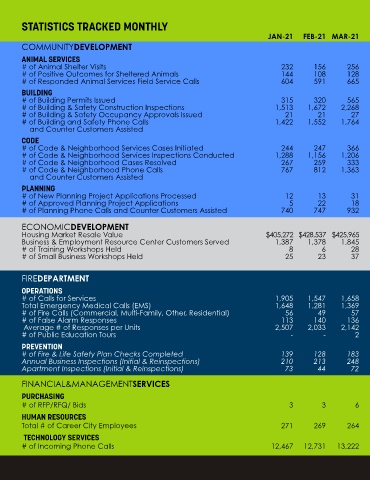
STATISTICS TRACKED MONTHLY
                                                                                          JAN-21     FEB-21  MAR-21           APR-21  MAY-21  JUN-21  JUL-21  AUG-21                SEP-21  OCT-21  NOV-21  DEC-21               TOTAL
        COMMUNITYDEVELOPMENT
        ANIMAL SERVICES
        # of Animal Shelter Visits                                                            232        156        256            234       224      1,177      1,742      1,297     1,468      1,354      1,321      1,545    11,006
        # of Positive Outcomes for Sheltered Animals                                           144       108        128            153       161        215        253        191       236        217        210        195      2,211
        # of Responded Animal Services Field Service Calls                                     604       591        665            650       690        814        866        755       633        766        666        664      8,364
        BUILDING
        # of Building Permits Issued                                                           315       320        565            410       546        560        510        466       465        446        562        420      5,585
        # of Building & Safety Construction Inspections                                      1,513     1,672      2,268          2,050     2,040      2,621      2,508      2,595     2,753      2,308      2,442      2,254    27,024
        # of Building & Safety Occupancy Approvals Issued                                       21        21         27             22         29         34        39         26         85         41        49         95        489
        # of Building and Safety Phone Calls                                                 1,422     1,552      1,764          1,758     1,726      2,367      2,091      1,985     2,193      2,154      1,792      1,639    22,443
          and Counter Customers Assisted
        CODE
        # of Code & Neighborhood Services Cases Initiated                                      244       247        366            403       490        298        321        364       298        307        256        188      3,782
        # of Code & Neighborhood Services Inspections Conducted                             1,288      1,156      1,206            959     1,041        912      1,591      1,631     1,698      1,774      1,263      1,059    15,578
        # of Code & Neighborhood Cases Resolved                                               267        259        333            251       264        248        516        552       512        434        305        236      4,177
        # of Code & Neighborhood Phone Calls                                                   767       812      1,363          1,188     1,253      1,481      1,186      1,489     1,538      1,226      1,104        879    14,286
          and Counter Customers Assisted
        PLANNING
        # of New Planning Project Applications Processed                                        12        13         31             10         31         21        26         29         33         39        27         42        314
        # of Approved Planning Project Applications                                              5        22         18             31          6         10        13         23         18          2          9          9       166
        # of Planning Phone Calls and Counter Customers Assisted                               740       747        932            867       914      1,119      1,060        942     1,099        211        928        642    10,201


        ECONOMICDEVELOPMENT
        Housing Market Resale Value                                                       $405,272   $428,537   $425,965      $426,514   $437,728   $447,377   $469,412   $468,684   $484,247   $486,262   $492,144   $506,172    $456,526
        Business & Employment Resource Center Customers Served                               1,387     1,378      1,845          1,200     1,244      1,471      1,916      1,388     1,654      1,674      1,534        926    17,617
        # of Training Workshops Held                                                              8         6        28              9         20         11         8          9          7          7        18           7       138
        # of Small Business Workshops Held                                                      25        23         37             25         12         26        22         14         29         36        16           4       269


        FIREDEPARTMENT

        OPERATIONS
        # of Calls for Services                                                             1,905      1,547      1,658          1,681     1,780      1,754      1,913      2,117     1,880      1,936      1,802      1,929    21,902
        Total Emergency Medical Calls (EMS)                                                  1,648     1,281      1,369          1,410     1,490      1,461      1,595      1,785     1,565      1,621      1,487      1,603    18,315
        # of Fire Calls (Commercial, Multi-Family, Other, Residential)                          56        49         57             58         62         64        74         67         58         48        65         55        713
        # of False Alarm Responses                                                             113       140        136             86       122        119        150        156       156        177        151        168      1,674
         Average # of Responses per Units                                                   2,507      2,033      2,142          2,126     2,384      2,355      2,626      2,875     2,500      2,402      2,398      2,419    28,767
        # of Public Education Tours                                                               -         -          2             2          8           -         -          -        10          3        10         38         73
        PREVENTION
        # of Fire & Life Safety Plan Checks Completed                                         139        128        183            154       156        138        104        123       129        157        195        145      1,751
        Annual Business Inspections (Initial & Reinspections)                                 210        213        248            106         73       136         95        297       135        128         74        108      1,823
        Apartment Inspections (Initial & Reinspections)                                         73        44         72             54       129          57        52         53         26         61        63         40        724

        FINANCIAL&MANAGEMENTSERVICES

        PURCHASING
        # of RFP/RFQ/ Bids                                                                       3          3          6            10         10          8         1          4          5          6          4          5        65
        HUMAN RESOURCES
        Total # of Career City Employees                                                       271       269        264           265        264        266        266       263        265        266        271        268        267
         TECHNOLOGY SERVICES
        # of Incoming Phone Calls                                                          12,467    12,731    13,222          14,460    14,092    15,351    13,325    13,032    13,064    12,396    10,900    10,843    155,883
   7   8   9   10   11   12   13   14   15   16