Page 17 - City of Moreno Valley Invstment and Cash Management Program
P. 17

Investment
        REPORTS


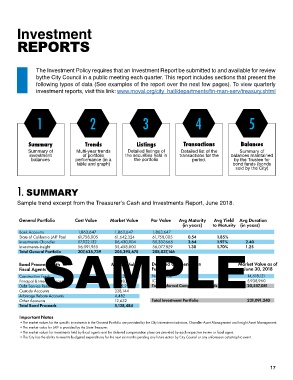
                The Investment Policy requires that an Investment Report be submitted to and available for review
                bythe City Council in a public meeting each quarter. This report includes sections that present the
                following types of data (See examples of the report over the next few pages). To view quarterly
                investment reports, visit this link: www.moval.org/city_hall/departments/fin-man-serv/treasury.shtml


                1                      2                     3                     4                     5


             Summary                 Trends               Listings            Transactions            Balances
             Summary of          Multi-year trends    Detailed listings of   Detailed list of the    Summary of
             investment             of portfolio     the securities held in   transactions for the   balances maintained
              balances           performance (in a       the portfolio           period.           by the Trustee for
                                 table and graph)                                                 bond funds (bonds
                                                                                                   sold by the City)


        1. SUMMARY


        Sample trend excerpt from the Treasurer’s Cash and Investments Report, June 2018.


           General Portfolio          Cost Value       Market Value        Par Value       Avg Maturity       Avg Yield     Avg Duration
                                                                             (in years)   to Maturity  (in years)
         Bank Accounts            1,863,647              1,863,647             1,863,647
         State of California LAIF Pool  61,758,005              61,642,324              61,758,005           0.54             1.85%
         Investments-Chandler     87,922,132              86,430,904              88,337,665           2.64              1.97%     2.40
         Debt Service Reserve Funds SAMPLE
                                  56,091,955
         Investments-Insight
                                                                                                 1.70%
                                                                                                        1.25
                                                       55,458,800             56,077,829
                                                                                    1.30
                                  207,635,739             205,395,675            208,037,146
         Total General Portfolio


           Bond Proceeds with                              Market Value     Deferred Compensation                        Market Value as of
                                                                  Funds
                                                                                                          June 30, 2018
           Fiscal Agents                               689,355             Nationwide                                  14,618,121


         Construction Funds

                                                                ICMA
         Principal & Interest Accounts
                                                                                                               20,557,081

                                                       2,115,234
         Custody Accounts                                  1,988,637               Total Deferred Compensation Funds                  5,938,960
                                                       328,144
         Arbitrage Rebate Accounts                     4,482
         Other Accounts                                12,632               Total Investment Portfolio                   231,091,240
         Total Bond Proceeds                           5,138,484
         Important Notes
         •The market values for the specific investments in the General Portfolio are provided by the City's investment advisors, Chandler Asset Management and Insight Asset Management.
         •The market value for LAIF is provided by the State Treasurer.
         •The market values for investments held by fiscal agents and the deferred compensation plans are provided by each respective trustee or fiscal agent.
         •The City has the ability to meet its budgeted expenditures for the next six months pending any future action by City Council or any unforeseen catastrophic event.
                                                                                                                  17
   12   13   14   15   16   17   18   19   20   21   22