
Page 11 - 2023 Moreno Valley Popular Annual Financial Report
P. 11
CHANGE iN
N E T P O S i T i O N
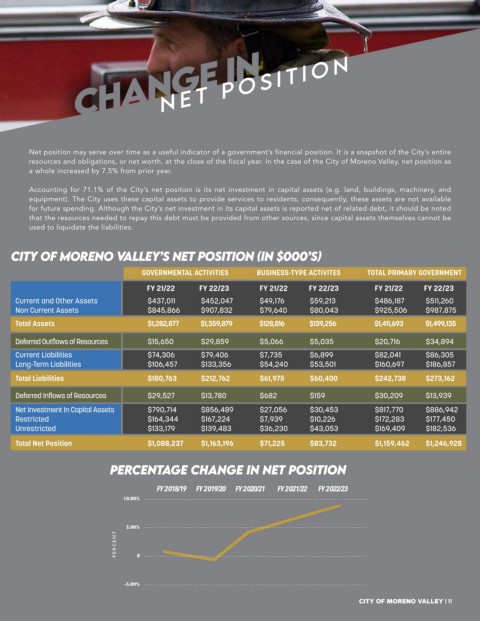
Net position may serve over time as a useful indicator of a government’s financial position. It is a snapshot of the City’s entire
resources and obligations, or net worth, at the close of the fiscal year. In the case of the City of Moreno Valley, net position as
a whole increased by 7.5% from prior year.
Accounting for 71.1% of the City’s net position is its net investment in capital assets (e.g. land, buildings, machinery, and
equipment). The City uses these capital assets to provide services to residents; consequently, these assets are not available
for future spending. Although the City’s net investment in its capital assets is reported net of related debt, it should be noted
that the resources needed to repay this debt must be provided from other sources, since capital assets themselves cannot be
used to liquidate the liabilities.
CITY OF MORENO VALLEY’S NET POSITION (iN $000’S)
GOVERNMENTAL ACTIVITIES BUSINESS-TYPE ACTIVITES TOTAL PRIMARY GOVERNMENT
FY 21/22 FY 22/23 FY 21/22 FY 22/23 FY 21/22 FY 22/23
Current and Other Assets $437,011 $452,047 $49,176 $59,213 $486,187 $511,260
Non Current Assets $845,866 $907,832 $79,640 $80,043 $925,506 $987,875
Total Assets $1,282,877 $1,359,879 $128,816 $139,256 $1,411,693 $1,499,135
Deferred Outflows of Resources $15,650 $29,859 $5,066 $5,035 $20,716 $34,894
Current Liabilities $74,306 $79,406 $7,735 $6,899 $82,041 $86,305
Long-Term Liabilities $106,457 $133,356 $54,240 $53,501 $160,697 $186,857
Total Liabilities $180,763 $212,762 $61,975 $60,400 $242,738 $273,162
Deferred Inflows of Resources $29,527 $13,780 $682 $159 $30,209 $13,939
Net Investment In Capital Assets $790,714 $856,489 $27,056 $30,453 $817,770 $886,942
Restricted $164,344 $167,224 $7,939 $10,226 $172,283 $177,450
Unrestricted $133,179 $139,483 $36,230 $43,053 $169,409 $182,536
Total Net Position $1,088,237 $1,163,196 $71,225 $83,732 $1,159,462 $1,246,928
PERCENTAGE CHANGE IN NET POSITION
FY 2018/19 FY 2019/20 FY 2020/21 FY 2021/22 FY 2022/23
10.00%
5.00%
PERCENT 0
-5.00%
City of Moreno Valley | 11