
Page 15 - Moreno Valley Citizen's Guide to the Budget
P. 15
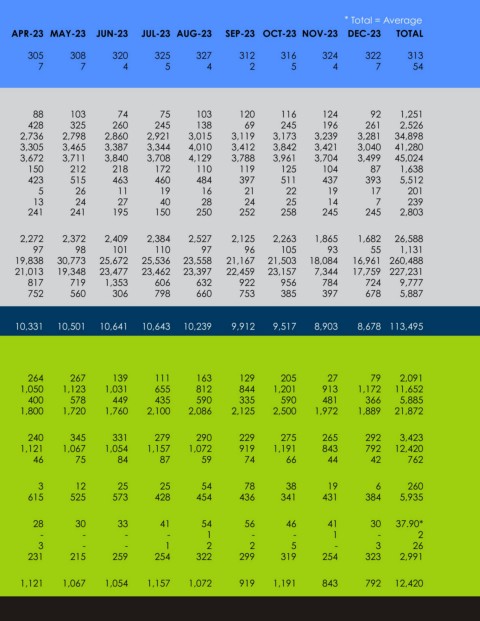
* Total = Average
 JAN-23  FEB-23 MAR-23  APR-23 MAY-23  JUN-23  JUL-23 AUG-23  SEP-23 OCT-23 NOV-23        DEC-23      TOTAL
 HUMANRESOURCES
 Total # of Active Career City Employees   295    300    300    305    308    320    325    327    312    316    324    322    313
 Total # of New Hires    2    4    3    7    7    4    5    4    2          5         4          7         54


 PARKS&COMMUNITYSERVICES
 # of Contract Class Sessions Conducted   80    168    108    88    103    74    75    103    120    116    124    92    1,251
 # of Recreation Programs Participants  116    113    130    428    325    260    245    138    69    245    196    261    2,526
 # of Seniors Registered at Senior Center  2,542    2,577    2,637    2,736    2,798    2,860    2,921    3,015    3,119    3,173    3,239    3,281   34,898
 # of Senior Programs Attendance  3,266    3,069    3,719    3,305    3,465    3,387    3,344    4,010    3,412    3,842    3,421    3,040   41,280
 # of Senior Meals Served (FSA & Senior Eats)  3,579    3,554    3,879    3,672    3,711    3,840    3,708    4,129    3,788    3,961    3,704    3,499   45,024
 # of Facilities and Room Rentals  49    64    228    150    212    218    172    110    119    125    104    87    1,638
 # of Customers Served at CRC Front Desk (physical)  552    371    506    423    515    463    460    484    397    511    437    393    5,512
 # of Resolved Graffiti-related Incidents  15    17    13    5    26    11    19    16    21    22    19    17    201
 # of Landscape Services Calls for Service/Responses/Work Orders   15    5    17    13    24    27    40    28    24    25    14    7    239
 # of Students Served in All After School Programs  243    243    240    241    241    195    150    250    252    258    245    245    2,803
 LIBRARY
 # of Computer Sessions      1,987    2,031    2,671    2,272    2,372    2,409    2,384    2,527    2,125    2,263    1,865    1,682   26,588
 # of Public Programs     81    100    98    97    98    101    110    97    96    105    93    55     1,131
 # of Visitors      17,471   17,887   22,038    19,838   30,773   25,672   25,536   23,558   21,167   21,503   18,084   16,961   260,488
 # of Circulated Items       5,902   17,933   21,980    21,013   19,348   23,477   23,462   23,397   22,459   23,157    7,344   17,759   227,231
 # of New Library Materials  674    156    1,434    817    719    1,353    606    632    922    956    784    724    9,777
 # of Library Outreach/Craft & Activity Kits Distributed  278    136    184    752    560    306    798    660    753    385    397    678    5,887

 POLICEDEPARTMENT
 # of Calls for Service       10,840   10,641   11,327    10,331   10,501   10,641   10,643   10,239    9,912    9,517    8,903    8,678   113,495


 PUBLICWORKS

 MAINTENANCE & OPERATIONS
 # of Potholes Repaired      190    314    203    264    267    139    111    163    129    205    27    79    2,091
 # of Graffiti Abated Locations      1,058    850    943    1,050    1,123    1,031    655    812    844    1,201    913    1,172   11,652
 # of Calls for Service/Work Orders Received      585    424    652    400    578    449    435    590    335    590    481    366    5,885
 # of Curb Miles Swept through Street Sweeping Program  1,560    1,235    1,125    1,800    1,720    1,760    2,100    2,086    2,125    2,500    1,972    1,889   21,872
 LAND DEVELOPMENT
 # of Development Reviews Conducted     283    280    314    240    345    331    279    290    229    275    265    292    3,423
 # of Inspections Conducted      1,049    1,087    1,068    1,121    1,067    1,054    1,157    1,072    919    1,191    843    792   12,420
 # of Permits Issued      63    47    75    46    75    84    87    59    74    66    44        42       762

 TRANSPORTATION
 # of Centerline Miles of Roadway Striping     -      -      -      3    12    25    25    54    78    38    19    6    260
 # of Traffic Signs Maintained       588    558    602    615    525    573    428    454    436    341    431    384    5,935

 MVU
 Peak Demand (reported in megawatts)     39    28    28    28    30    33    41    54    56    46    41    30    37.90*
 # of Planned/Unplanned Power Outages      -      -      -      -      -      -      -      1    -      -      1    -      2
 # of Street Lights Knocked Down     3    4    3    3    -      -      1    2    2    5    -      3        26
 # of Vehicles Charged (Fast Charged or Level 2 Charged)      167    186    162    231    215    259    254    322    299    319    254    323    2,991
 ALL PUBLIC WORKS DEPARTMENTS
 # of Inspections Conducted  1,049    1,087    1,068    1,121    1,067    1,054    1,157    1,072    919    1,191    843    792   12,420